.png)
In the dynamic world of B2B sales and marketing, achieving seamless alignment between these two critical departments often feels like an uphill battle. Marketers generate leads, sales reps close deals, and yet, the disconnect can persist, leading to finger-pointing, missed targets, and suboptimal revenue growth. What if there was one key performance indicator (KPI) that could not only bridge this gap but also empower both teams to work in perfect harmony towards a shared goal: accelerated revenue?
Enter Pipeline Velocity.
Pipeline Velocity is more than just a metric; it's the heartbeat of your revenue generation engine. It quantifies how quickly deals move through your sales pipeline and, crucially, how much value they contribute over a specific period. For the CMO, understanding and leveraging Pipeline Velocity is the secret weapon to transforming sales and marketing into a unified, high-performing revenue machine.
What is Pipeline Velocity and Why Does it Matter?
At its core, Pipeline Velocity answers a critical question: "How fast are we converting opportunities into revenue?" It measures the rate at which value flows through your pipeline, taking into account four key factors:
- Number of Opportunities: The sheer volume of deals in your pipeline.
- Average Deal Size: The average monetary value of each deal.
- Win Rate: The percentage of opportunities that close successfully.
- Sales Cycle Length: The average time it takes to close a deal from creation to win.
The formula is elegantly simple:
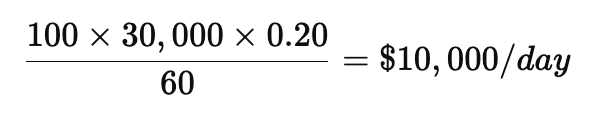
Pipeline Velocity = (Number of Opportunities x Average Deal Size x Win Rate) / Sales Cycle Length
Let’s take an example:
Context: You’re the CRO at a B2B SaaS company selling a platform to mid-market HR teams.
You’re diagnosing how quickly the pipeline is converting into revenue and where the bottlenecks are. Here’s the current pipeline data for Q1:
- Number of Opportunities: 50 qualified sales opportunities
- Average Deal Size: $30,000
- Win Rate: 20% (0.20)
- Sales Cycle Length: 60 days
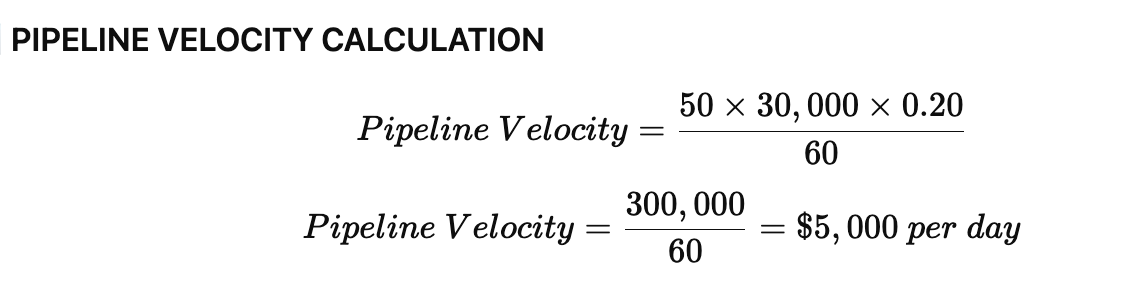
This means:
You are generating $5,000/day in expected revenue flow from your current pipeline, assuming typical performance holds.
A few insights that someone in your role could act on:
- Boost win rate from 20% → 25% via better enablement, objection handling, or strategic positioning

That's a 25% increase in velocity just from win rate improvements - no need to add leads.
Reduce sales cycle from 60 to 45 days via tighter deal orchestration and urgency plays →

That’s a 33% increase in velocity — acceleration equals compounding.
Double pipeline volume from 50 to 100 via a demand creation motion (e.g., event-led growth or a problem-centric content strategy) →
Demand creation becomes a clear driver of revenue velocity if quality holds.
As an advanced marketer, you should think of Pipeline Velocity as a diagnostic lens — not just a reporting metric.
Each lever in the equation is a strategic play:
- Volume (Opportunities) = Demand Creation
- Deal Size = Strategic Positioning + Value Packaging
- Win Rate = Messaging Precision + Sales/Marketing Alignment
- Sales Cycle = Sales Process Efficiency + Urgency
Understanding this formula is the first step, but comprehending its implications is where the real power lies. A higher pipeline velocity indicates a more efficient, faster-moving sales process, directly translating to increased revenue predictability and growth.
The CMO's Role: Unifying Teams with a Shared Metric
For too long, marketing has been measured by MQLs (Marketing Qualified Leads) and brand awareness, while sales has focused on closed-won deals and quota attainment. These disparate metrics inherently create silos. Pipeline Velocity shatters these silos by offering a single, unifying KPI that both teams can actively influence and be accountable for.
How Marketing Impacts Velocity:
- Number of Opportunities: Marketing directly influences the top of the funnel by generating high-quality leads. More relevant leads mean more opportunities entering the pipeline.
- Average Deal Size: By segmenting and targeting ideal customer profiles, marketing can attract leads that are likely to result in larger deals.
- Win Rate: High-quality leads nurtured with relevant content improve the likelihood of conversion, positively impacting the win rate.
- Sales Cycle Length: Content that educates prospects and addresses common objections can accelerate the buyer's journey, shortening the sales cycle.
How Sales Impacts Velocity:
- Number of Opportunities: While primarily marketing's domain, sales can identify new opportunities through prospecting and referrals.
- Average Deal Size: Effective discovery and value-based selling can increase the scope and value of deals.
- Win Rate: Sales' ability to qualify, present, negotiate, and close deals directly impacts the win rate.
- Sales Cycle Length: Efficient sales processes, quick follow-ups, and proactive objection handling shorten the sales cycle.
When both teams understand how their actions contribute to Pipeline Velocity, a powerful shift occurs. Marketing is no longer just "generating leads"; they are "fueling the velocity engine." Sales is no longer "just closing deals"; they are "optimizing the flow rate."
Now, consider the transformation when sales and marketing align around Pipeline Velocity:
- Marketing focuses on attracting higher-quality leads that are a better fit, increasing both the number of qualified opportunities and the average deal size potential.
- Sales benefits from better-qualified leads, leading to improved win rates and less time spent on unsuitable prospects, thus shortening the sales cycle.
This alignment drastically improves the flow, making your revenue engine much more efficient.
The Power of Revenue Reporting
To effectively manage and optimize Pipeline Velocity, robust revenue reporting is non-negotiable. The CMO needs a comprehensive view that consolidates data from marketing automation, CRM, and sales enablement platforms. This reporting should provide:
- Real-time Visibility: Track pipeline velocity metrics in real-time, identifying bottlenecks as they emerge.
- Segmented Analysis: Understand velocity by product, region, sales rep, or lead source to pinpoint areas for improvement.
- Trend Analysis: Monitor changes in velocity over time to assess the impact of strategic initiatives.
- Forecasting Accuracy: Use velocity trends to improve revenue predictions and resource allocation.
This chart demonstrates how specific initiatives, from marketing content to sales reorganization and unified dashboards, directly contribute to an upward trend in Pipeline Velocity.
Practical Steps for the CMO
- Define and Communicate: Clearly define Pipeline Velocity for both teams and communicate its importance as the primary shared KPI.
- Implement Integrated Reporting: Invest in a RevOps dashboard or reporting tool that provides a unified view of all velocity components, accessible to both sales and marketing leadership.
- Cross-Functional Planning: Conduct regular joint planning sessions where sales and marketing collaboratively identify strategies to optimize each component of the velocity formula.
- Align Incentives (Where Appropriate): Consider how incentives can be structured to reward both teams for contributing to improved Pipeline Velocity.
- Continuous Optimization: Regularly review velocity metrics, identify bottlenecks (e.g., a stage where deals consistently stall), and implement targeted interventions.
The Future is Unified
By embracing Pipeline Velocity, the CMO can move beyond traditional, often isolating, metrics. This single KPI fosters a culture of shared accountability, continuous improvement, and mutual respect between sales and marketing. It shifts the focus from departmental outputs to unified revenue outcomes, ensuring that every effort, from the first marketing touchpoint to the final closed deal, is working synergistically to accelerate your business growth.
The era of misalignment is over. The future of revenue generation is fast, predictable, and, above all, unified by Pipeline Velocity.